.
We often hear the phrase "presentation is everything". It suggests that the way something is displayed or framed can be just as significant, if not more so, than what is being shown.
A dish served elegantly can enhance its taste, a song with the right intro can move us even before the lyrics kick in, and in visual arts, the way an artwork is presented can dictate our perception of it. This subtle dance between the content and its presentation brings to light an interesting perspective: sometimes, the frame matters more than the picture
.
In this blog, we'll delve into how companies, like Apple and Coca Cola, have mastered the art of framing their narratives and products and as we peel back the layers, we'll see how this very concept of framing is ever so relevant in the realm of Data Science.
The frame matters more than the picture
The frame matters more than the picture is truly personified by the thinking, design and philosophy behind Apple and its iconic store designs.
.
When we step into an Apple store, we're not just entering a retail space; we are in fact walking into a carefully designed environment reminiscent of an art gallery. Every product, from the latest iPhone to the sleekest MacBook, is given its own stage, allowing it to shine and be appreciated in its full glory. This is by design. This is the frame that Apple is creating…
In retail spaces, every square foot matters, and the cost associated with it is significant. Yet, Apple's store design hints at a bold strategy. By leaving expansive gaps between its products, Apple is signalling that it's willing to sacrifice potential rent revenue - intentionally designed to underscore the idea that what's in the middle, i.e., the product, is of immense value. It's a strategic move, a frame, making the product a centrepiece in a vast canvas of space. By drawing parallels between their stores and art galleries, Apple communicates, frames the narrative, that its products are pieces of art, worthy of admiration and appreciation.
.

.
.
Coca-Cola vs. Pepsi Taste Test
.
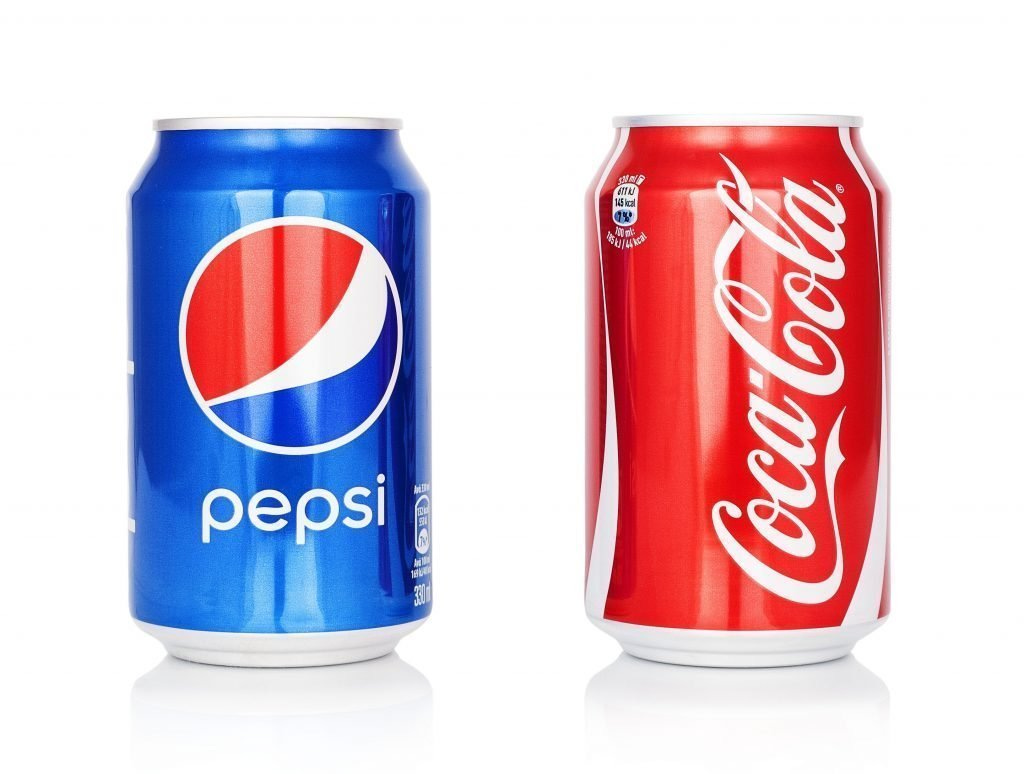
The way a problem or experiment is framed can profoundly influence outcomes and perceptions. A classic illustration of this principle is the Pepsi vs. Coca-Cola taste test.
In a blind taste test, where participants sampled both beverages from unlabelled glasses, the majority favoured Pepsi. On the surface, this might imply that Pepsi has a more appealing taste. However, the experiment was repeated but this time, the brands were disclosed - and at the end of the experiment, the narrative had changed. The legacy and long-standing emotional connection, built over decades of branding and shared experiences, nudged many participants to pivot towards Coca-Cola. By revealing the branding, participants perception of taste had changed.
.
This shift underscores the significance of framing. It's not merely about the product's intrinsic qualities, like taste in this instance. The broader context, the "frame" in which the product is presented, plays a pivotal role. In this case, Coca-Cola's storied history, iconic branding, and cultural significance became part of the tasting experience, influencing preferences.
.
In essence, while the "picture" (the product) remains constant, the "frame" (branding and associated narratives) can dramatically alter perceptions.
.
This phenomenon serves as a compelling reminder for businesses and problem solvers: the context in which you present your product can be just as crucial, if not more so, than the product itself.
Anchoring Effect
.
In the realm of decision-making, the way options are presented to us can significantly influence our choices. This phenomenon, known as choice anchoring, demonstrates how the frame around a decision can be more impactful than the decision itself.
.
The Rome Vacation Dilemma
In "Predictably Irrational", Dan Ariely presents a compelling example of choice anchoring. Imagine you're given three vacation packages to choose from:
A luxurious trip to Rome with free breakfast.
A similar trip to Rome but without breakfast.
A trip to Paris with free breakfast.
When presented with these options, most people would dismiss the Rome trip without breakfast as it seems inferior to the other Rome option.
This makes the luxurious Rome trip with breakfast appear more appealing, even if Paris might have been their initial preference.
The presence of a slightly inferior option (Rome without breakfast) serves as an anchor, making another option (Rome with breakfast) seem more valuable.
.
It's not just the choices themselves that matter, but how they are framed in relation to one another.
.
Data Science
Reductionist framing vs. Systems framing
.
.
The Boiler Failure Conundrum
I famously worked on a predictive maintenance project, particularly for residential boilers, and experienced first-hand how the framing of the problem can drastically alter the approach and the solution. The stakeholder asked:
.
Are boiler breakdowns predictable?
.
Consider the following scenarios:
.
Frame A: "When will the boiler fail?"
This framing leads one down the path of time-series forecasting. The immediate approach might be to analyse historical data and features on boiler failures and predict when the next failure might occur.
.
Frame B: "What components of the boiler are most prone to failure, and what are the leading indicators?"
By shifting focus from the boiler as a whole (system view) to its individual components (reductionist view), we can harness sensor data and breakdown records to pinpoint failure-prone parts using techniques like survival analysis. This proactive approach allows for timely maintenance, replacing components before failure, optimising efficiency.
.
The framing of the problem not only guides the analysis but also the solution. It's vital to ask the right questions. In data science, as in art, the frame often carries more weight than the picture inside.
.
In data science, as in art, the frame often carries more weight than the picture inside.
.
Statistics, when framed in a certain way, can present a deceptive view of reality. Let's consider a hypothetical drug trial:
Scenario A: A new drug is tested, and the results show that it has a 95% success rate.
Scenario B: The same drug is tested, but the report highlights that 5% of the patients experienced severe side effects.
Both scenarios present the same data, but the framing is different. In Scenario A, the emphasis is on the high success rate, painting a positive picture. In Scenario B, the focus shifts to the potential risks, casting a shadow over the drug's efficacy.
A model might boast a high accuracy rate, but when we delve deeper into the metrics, we might find that it has a high false positive or false negative rate. Merely framing the results around accuracy can be misleading. It's the deeper metrics like precision, recall, and F1 score that provide a more comprehensive picture.
.
First Principles
First principles thinking is where you break down complex problems into their most basic, fundamental truths. From there, you reconstruct the problem, layer by layer, to gain a deeper understanding.
.
I had a project that involved predicting sales for a retail chain. The initial problem statement was: "Predict next month's sales for each store." While it seemed straightforward, the results from the initial models were far from satisfactory, so I decided to break the problem down. Instead of looking at it as a singular task of predicting sales, I asked myself: "What are the fundamental components that drive sales?"
.
It's not just about finding answers but asking the right questions.
.
This line of questioning led me to reframe the problem:
Customer Traffic: How many customers walk into the store?
Time series analysis can be helpful here - accounting for seasonality and trends to predict the number of customers walking into the store. External factors like holidays, promotions, and local events can be considered to enhance the model's accuracy.
.
Conversion Rate: Out of the visitors, how many make a purchase?
Logistic regression can be handy here. By analysing customer behaviour data, you can identify patterns that led to a purchase. Features included the time spent in-store, sections visited, and even the day of the week.
.
Average Purchase Value: How much does each customer spend on average?
A regression model using customer demographics, past purchase history, and in-store behaviour would be helpful - allowing for the prediction of the average spend of each customer on their next visit.
.
By reframing the problem into these three fundamental questions, I was no longer just predicting sales. I was diving into the core drivers of sales. This approach allowed me to build separate models for each component, which when combined, gave a more accurate sales prediction.
.
By understanding the core drivers, the retail chain could now strategise better. If customer traffic was low, they could invest in marketing. If the conversion rate was low, perhaps the in-store experience needed improvement. If the average purchase value was declining, maybe they needed to revisit their product mix or pricing strategy.
This experience taught me a valuable lesson: In data science, and in many other fields, the way you frame a problem can be the difference between a mediocre solution and a game-changing insight. It's not just about finding answers but asking the right questions. And often, those questions lie in understanding the basic principles that drive the bigger picture.
.
Project Management
I once had the privilege of working alongside two incredibly talented project managers on a significant project. Both were given the same task, but their approaches were distinctly different. One of them, let's call him John, was laser-focused on the project's immediate scope. He zeroed in on the essential deliverables, ensuring that the team met the basic requirements and nothing more. His mantra was efficiency and speed.
.
On the other hand, Sarah, the other project manager, took a more holistic approach. She wasn't just looking at the immediate deliverables. Instead, she considered potential risks, actively sought stakeholder feedback, and constantly thought about how the project could scale in the future. She believed in building not just for today, but for tomorrow as well.
.
While John's project wrapped up swiftly, it was Sarah's project that truly stood out. By framing the project in a more comprehensive manner, she ensured that the end result was not only robust but also scalable and closely aligned with what the stakeholders truly wanted.
.
This experience was a vivid reminder for me: it's not just about the picture we're trying to paint but the frame we choose to place it in. The frame doesn't merely hold the picture; it defines and shapes it. It's a perspective, a lens that can dramatically influence the outcome.
.
Concluding remarks
The way we choose to approach a question, the lens through which we view a challenge, can profoundly influence the outcomes. Whether it's predicting boiler failures, evaluating drug efficacy, or managing projects, the frame often dictates the direction, methodology, and eventual solution.
.
As data enthusiasts, professionals, and decision-makers, it's imperative to recognise the significance of framing. For in the intricate dance of problem-solving, it's not just the picture that matters, but the frame that holds it.


